Debugging within pm-netbank/apps
Are you tired of writing console.log to reach your goals on completing the task?
Are you tired of forget removing console.log(s) before submitting your code?
or You already know what is in this documentation but want to see it anyway?
Don't worry my friend I got you covered.
In this document you will find three different methods to debug an app built within pm-netbank environment.
Contents
Different methods of debugging
Under this title you will find three different methods of debugging.
Before debugging you should make sure that the app you want to debug is already running. For example if we want to debug apps/pm-netbank/cards app you can use command below to run the app.
yarn nx serve pm-netbank/cards
Method 1.Attaching Vscode debugger to Chrome
This method allows us to inspect the code within vscode and gives us flexibility of using the vscode debugger while running the app on the browser.
Configuration
To enable debugging we have to create launch.json file under .vscode folder within root directory of dnb-web mono-repo. If you already have one we are going to edit it. You can find more information about what are those fields means here 👉 vscode-js-debug/blob/main/OPTIONS.md#pwa-chrome-attach.
{
  "version": "0.2.0",
  "configurations": [
    {
      "name": "Attach to Chrome",
      "port": 9222,
      "request": "attach",
      "type": "chrome",
      "webRoot": "${workspaceFolder}",
      "url": "http://localhost:4200"
    }
  ]
}
Once you have created this 👆 file we are going to start the chrome app with --remote-debugging-port=9222 command so Vscode debugger can attach to it. Below you will find how to do this within different environments.
Mac OS
/Applications/Google\ Chrome.app/Contents/MacOS/Google\ Chrome --remote-debugging-port=9222
Linux
google-chrome --remote-debugging-port=9222
If you google you can find more information about how to start Google Chrome always on debugging mode, create shortcuts and etc. for example here 👉how-to-make-chrome-always-launch-with-remote-debugging-port-flag
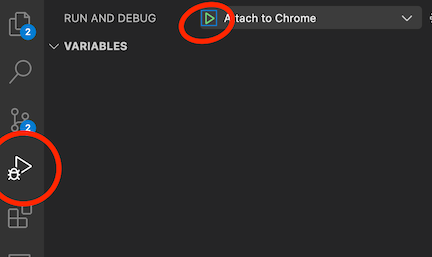
Once Google Chrome has started you can just go to your app url http://localhost:4200/ and start debugging from Vscode by clicking the debug button.
Method 2.Launching Chrome from Vscode
This method allows us to inspect the code within vscode and gives us flexibility of using the vscode debugger while running the app on the browser.
Configuration
To enable debugging we have to create launch.json file under .vscode folder within root directory of dnb-web mono-repo. If you already have one we are going to edit it. You can find more information about what are those fields means here 👉 vscode-js-debug/blob/main/OPTIONS.md#pwa-chrome-launch.
{
  "version": "0.2.0",
  "configurations": [
    {
      "type": "chrome",
      "request": "launch",
      "name": "Launch Chrome against localhost",
      "url": "http://localhost:4200",
      "webRoot": "${workspaceFolder}"
    }
  ]
}
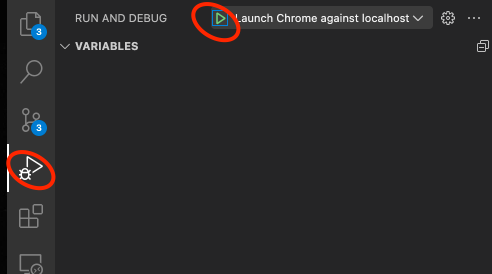
After you created/edited your launch.json file with this 👆 just go and click on start debug buttons shown bellow. Vscode will launch Google Chrome automatically and Vscode debugger will be attached.
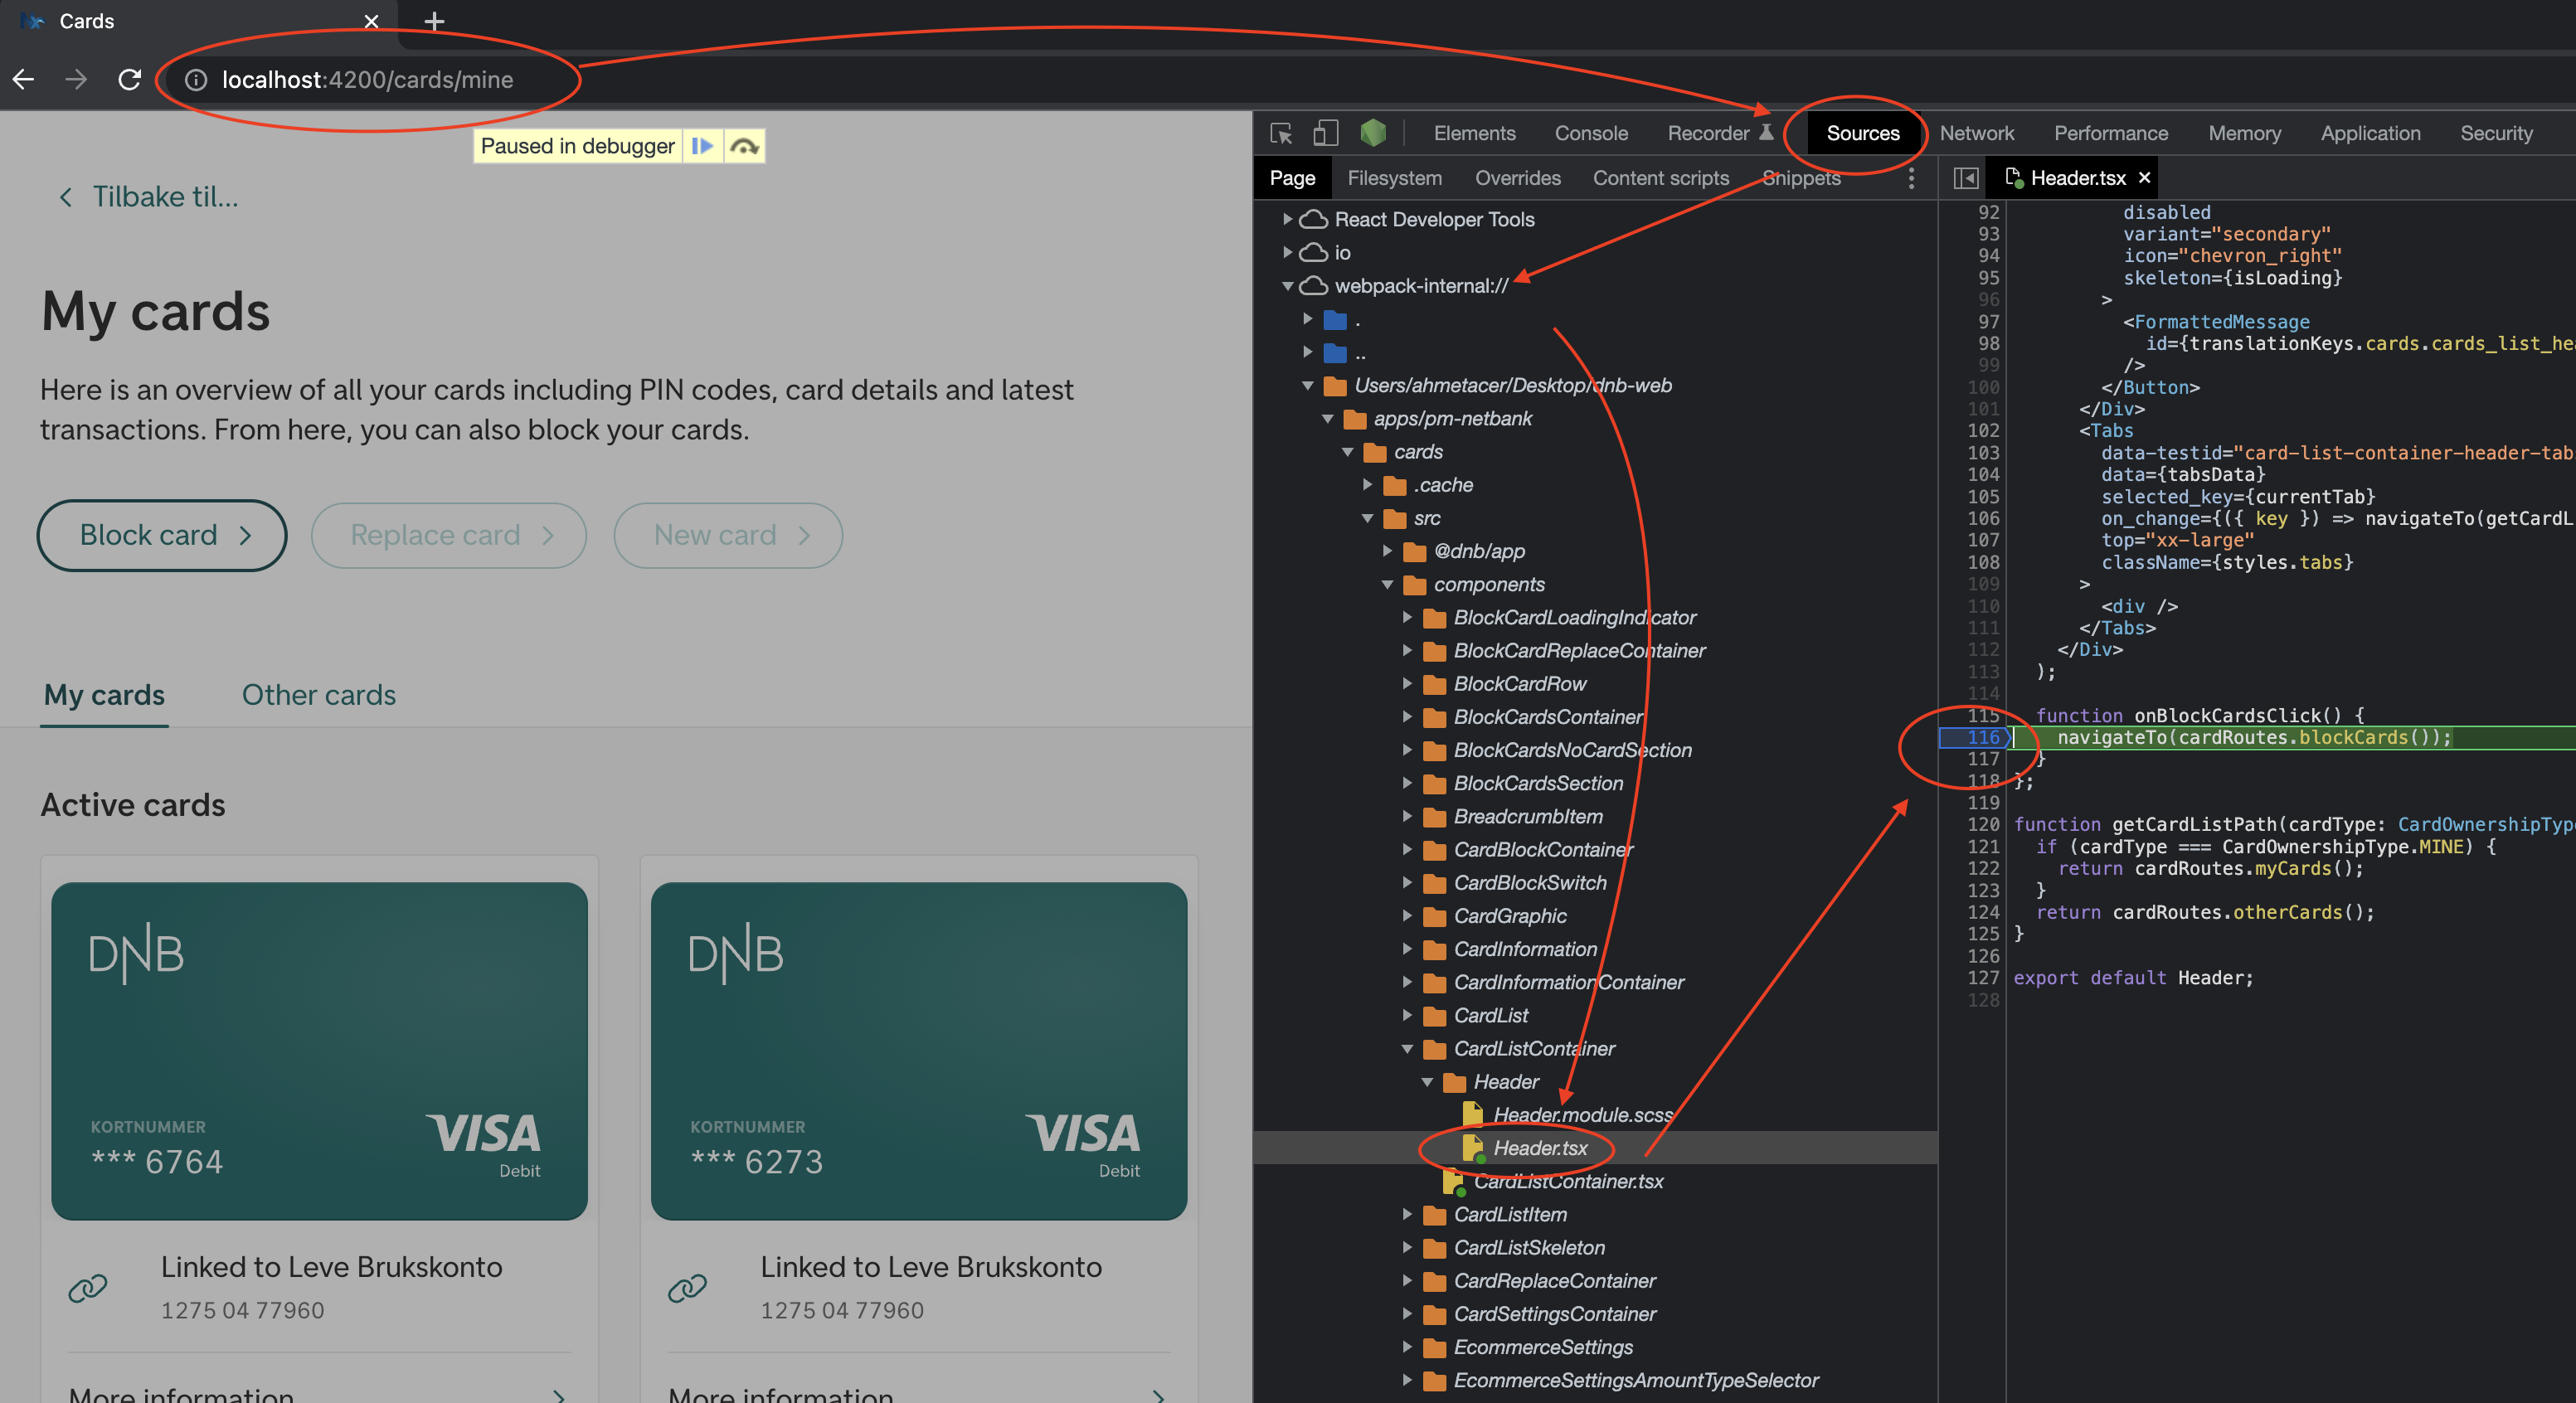
Method 3.Debugging from Chrome Devtools
This method does not require you to configure launch.json file just open your Google Chrome browser go to your app url http://localhost:4200 and open developer console. From dev console go to Sources tab and find the file that you want to debug under webpack-internal:// folder.